AIRS fast RT model comparisons
Background
There are now several fast RT models in use for simulating AIRS radiances and so it was recommended at the workshop on Sounding from High Spectral Resolution Infrared Observations in Madison to initiate an intercomparison along the lines of the recent ATOVS comparison co-ordinated by Louis Garand. This page provides the specification for such a comparison of AIRS fast RT models carried out as an ITWG activity and allows others to also take part if they wish and compare their model output with all the others which participated. The comparisons are of the forward model calculations, level to space transmittances and the Jacobians with respect to T(p), q(p) and O3(p). The results from the comparison of 14 models (see below) are now available and a draft paper to JGR is available on request from Roger Saunders . The results submitted by each of the models are available here and some plots of the results (from the JGR paper) are available here.
Profiles and other input data to use
52 ECMWF model profiles on 101 AIRS levels available at: http://www.metoffice.com/research/interproj/nwpsaf/rtm/
T (K), q (kg/kg) specific humidity, O3 (kg/kg) and Ps are specified. For the surface (e.g. skin temperature) the values (except Ps) are specified in a separate file with a link on the same site as the profile data. To convert from specific concentration q in kg/kg to volume mixing radio v in ppmv use the following equation:
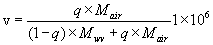
where Mair = 28.9644 and Mwv = 18.01528 are the molecular weights of dry air and water vapour and r is their ratio Mwv/Mair= 0.62198. It is recommended to use software provided here to interpolate profiles to other levels. For the surface assume a constant emissivity of 0.99 and the radiance of space to be zero. The profiles are assumed to be at night so there is no solar input. Line-by-line modellers should use their own default profiles for other gases or contact Roger Saunders for guidance. For the comparison with AIRS data the profiles and AIRS radiance data are at http://asl.umbc.edu/pub/hannon/Roger/TWP/
Channels to simulate
For the forward model comparison results for all AIRS channels using 18 August 02 ISRF version 1 from Larrabee Strowe should be used. They are available from the following web site: http://asl.umbc.edu/pub/airs/srf/ . The URL’s are:
http://asl.umbc.edu/pub/airs/srf/srftables-020818v1.hdf or ftp://asl.umbc.edu/pub/airs/srf/srftables-020818v1.hdf A document describing how to read this file is at http://asl.umbc.edu/pub/airs/srf/srfhdf.pdf or http://asl.umbc.edu/pub/airs/srf/srfhdf.html . If not all channels can be simulated then retain the same file format with 2378 channels but set those channels not simulated to have a brightness temperature of zero.
For level to space transmittance and Jacobians just 20 channels as defined in the table below should be submitted in order to make the file sizes manageable. The columns with a X in denote those elements of the state vector where transmittances and Jacobians will be compared but for simplicity it is suggested users submit results for all profile elements. In fact the temperature Jacobians for the water vapour channels are still of interest.
| AIRS channel number | Frequency (cm-1) | Level to space transmittance | Temperature jacobian | Water vapour jacobian | Ozone jacobian |
| 71 | 666.7 | X | X | ||
| 77 | 668.2 | X | X | ||
| 305 | 737.1 | X | X | ||
| 453 | 793.1 | X | X | X | |
| 672 | 871.2 | X | X | X | |
| 787 | 917.2 | X | X | ||
| 1021 | 1009.2 | X | X | X | |
| 1090 | 1040.1 | X | X | ||
| 1142 | 1074.3 | X | X | ||
| 1437 | 1323.8 | X | X | ||
| 1449 | 1330.8 | X | X | ||
| 1627 | 1427.1 | X | X | ||
| 1766 | 1544.3 | X | X | ||
| 1794 | 1563.5 | X | X | ||
| 1812 | 1576.1 | X | X | ||
| 1917 | 2229.3 | X | X | ||
| 1958 | 2268.7 | X | X | ||
| 1995 | 2305.5 | X | X | ||
| 2107 | 2385.9 | X | X | ||
| 2197 | 2500.3 | X | X |
Outputs required
See table below. For forward model runs 3 files are required for nadir, 45 deg and 60 deg local zenith angle from the surface. A plane parallel atmosphere is assumed for all calculations.
| dParameter | Units | Dimensions | Filenames | Status |
| TOA BT | K | 2378×52 | Fwd_nadir.dat Fwd_45deg.dat Fwd_60deg.dat | Mandatory for at least a channel subset. |
| dBT/dT | K/K | 20xjx52 | Jac_nadir.dat Jac_45deg.dat Jac_60deg.dat | Optional |
| dBT/dq | K/(kg/kg) | 20xjx52 | Optional | |
| dBT/dO3 | K/(kg/kg) | 20xjx52 | Optional | |
| Level to space transmittance | 0-1 | 20xjx52 | Optional |
For the Jacobians the temperature perturbation is +1K, for the specific humidity and ozone the perturbation is -1% of the layer mean concentration. For finite difference Jacobians it should be +/- 0.5K and +/- 0.5% of the layer mean concentration at the pressure levels used. If outputs are not on 101 levels provide on your own j levels and let the co-ordinator interpolate to the 101 levels. File formats are in ascii (see examples for RTTOV-7 here for forward model results and here for jacobian results). The FORTRAN code to write out the fwd files is here and for Jacobians is here. A record of the times taken to run the forward model computation for all channels and profiles and the Jacobians for 20 channels and all profiles should be given by email. When the results are compiled the details of the line by line model and spectroscopic datasets on which the fast model is based will also be required.
Current participants and status
| Model name Reference | Base model spectroscopy w.v. continuum line mixing | Participant | Results submitted Transmittances/Jacobian | Method |
| RTTOV-7 Saunders et al 1999 | GENLN2v2 Hitran-96 CKD2.1 Strow et al 1994 | R. Saunders, Met Office | Yes/ Analytic | Regression |
| RTTOV-8 Saunders et al 1999 | kCarta (1.11)1 Hitran-2004Modified MTCKD 1.0 DeSouza-Machado et al 1999 | R. Saunders, P. Brunel Met Office | Yes/ Analytic | Regression |
| Optran v7 Xiong and McMillin et. al. 2005, McMillin et al 2005 | LBLRTM v7.04 HITRAN-2000 MTCKD 1.0 Hoke et. al. 1989 | Y. Han, NESDIS | Yes/ Analytic | Regression |
| OSS Moncet et al 2004 | LBLRTMV8.3 HITRAN-2000 MTCKD 1.0 Hoke et. al. 1989 | J-L. Moncet, G. Uymin, AER | None/ Analytic | Pre-computed LUT |
| σ-IASIAmato et. al. 2002 | LBLRTMV8.1 HITRAN-2000 MTCKD 1.0 Hoke et. al. 1989 | G. Masiello,C. Serio,DIFA, UniBas | Yes/ Analytic | Pre-computed LUT |
| Gastropod 0.3.0Sherlock et. al. 2003 | kCarta 20001 Hitran-19982 CKD2.4 Strow et al 2003 | V. Sherlock, NIWA | Yes/ Analytic | Regression |
| SARTAv 1.05Strow et. al. 2003 | kCarta (1.07)1 Hitran-2000 Modified MTCKD 1.0 DeSouza-Machado et al 1999 | S. Hannon,L. Strow, UMBC | None/ None | Regression |
| PCRTMLiu et. al 2006 | LBLRTM v8.3 Hitran-2000 MTCKD 1.0 Hoke et. al. 1989 | Xu Liu,NASA, LaRC | Yes/ Analytical | LUT/ Regression |
1kCarta is described in Strow et. al. (1998)
2includes the Toth H2O lines
| Model name Reference | Base model spectroscopy w.v. continuum line mixing | Participant | Results submitted Transmittances/Jacobian | Method |
| RFM http://www.atm.ox.ac.uk/RFM | GENLN2 HITRAN-2000 CKD2.4 Strow et al 1994 | N. Bormann, ECMWF | Yes/ Finite diff | Full LbL computation |
| LBLRTM v8.3 Clough et. al. 1992 | HITRAN-2000 MTCKD 1.0 Hoke et al., 1989 | J-L. Moncet, AER | None/ Finite diff | Full LbL computation |
| ARTS 1.0.136 Buehler et. al. 2005 | HITRAN-2003 MTCKD 1.0 None | A. von Engeln, Bremen | None/ None | Full LbL computation |
| 4A Scott and Chédin, 1981 and http://www.noveltis.net/4AOP/ | STRANSAC GEISA 2001 Rodriguez et al 1999 | S. Heilliette, LMD | Yes/ Analytic | Pre-computed LUT |
| FLBL-3 Turner, 1995 | HITRAN-2001 CKD2.4 Strow et al 1998 | D.S. Turner, MSC | Yes/ Analytic | Pre-computed LUT |
| HARTCODE Miskolczi et al 1989 | HITRAN-2000 CKD2.4 Rodriguez et al 1999 | F. Miskolczi, NASA, LaRC | None/ None | Full LbL computation |
Timetable
June 03 – Announce to ITWG
Sep 03 – Collect initial results
Oct 03 – Present preliminary results at ITSC-13
Jun 05 – Presented final results at ITSC-14
Jan 06 – Paper submitted to JGR (Atmospheres)
Results
The results submitted by each of the models are available here. Some plots summarising an analysis of the results are also presented here.